


Next: The ALARM network
Up: Density estimation experiments
Previous: Density estimation experiments
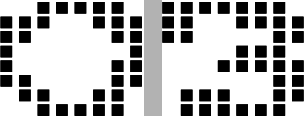
Figure 12:
An example of a digit pair.
 |
Our first density estimation experiment involved a subset of
binary vector representations of handwritten digits. The datasets
consist of normalized and quantized  binary images of
handwritten digits made available by the US Postal Service Office
for Advanced Technology. One dataset--which we refer to as the
``digits'' dataset--contains images of single digits in 64 dimensions.
The other dataset (``pairs'') contains 128-dimensional vectors
representing randomly paired digit images. These datasets,
as well as the training conditions that we employed, are described
by frey:95. (See Figure 12 for an
example of a digit pair). The training, validation and test sets
contained 6000, 2000, and 5000 exemplars respectively.
Each model was trained on the training set until the likelihood of
the validation set stopped increasing.
We tried mixtures of 16, 32, 64 and 128 trees, fit by the MIXTREE
algorithm. For each of the digits and pairs datasets we chose the
mixture model with the highest log-likelihood on the validation set
and using it we calculated the average log-likelihood over the test set
(in bits per example). The averages (over 3 runs) are shown in
Table 2.
In Figure 13 we compare our results (for
binary images of
handwritten digits made available by the US Postal Service Office
for Advanced Technology. One dataset--which we refer to as the
``digits'' dataset--contains images of single digits in 64 dimensions.
The other dataset (``pairs'') contains 128-dimensional vectors
representing randomly paired digit images. These datasets,
as well as the training conditions that we employed, are described
by frey:95. (See Figure 12 for an
example of a digit pair). The training, validation and test sets
contained 6000, 2000, and 5000 exemplars respectively.
Each model was trained on the training set until the likelihood of
the validation set stopped increasing.
We tried mixtures of 16, 32, 64 and 128 trees, fit by the MIXTREE
algorithm. For each of the digits and pairs datasets we chose the
mixture model with the highest log-likelihood on the validation set
and using it we calculated the average log-likelihood over the test set
(in bits per example). The averages (over 3 runs) are shown in
Table 2.
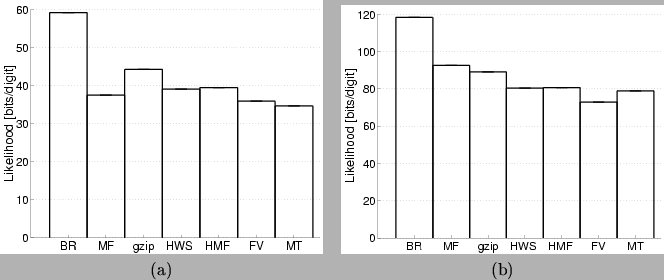
In Figure 13 we compare our results (for  ) with the
results published by frey:95. The algorithms plotted in
the figure are the (1) completely factored or ``Base rate'' (BR)
model, which assumes that every variable is independent of all the others,
(2) mixture of factorial distributions (MF), (3) the UNIX ``gzip''
compression program, (4) the Helmholtz Machine, trained by the
wake-sleep algorithm [Frey, Hinton, Dayan
1996] (HWS), (5) the same Helmholtz Machine
where a mean field approximation was used for training (HMF),
(5) a fully observed and fully connected sigmoid belief network (FV),
and (6) the mixture of trees (MT) model.
) with the
results published by frey:95. The algorithms plotted in
the figure are the (1) completely factored or ``Base rate'' (BR)
model, which assumes that every variable is independent of all the others,
(2) mixture of factorial distributions (MF), (3) the UNIX ``gzip''
compression program, (4) the Helmholtz Machine, trained by the
wake-sleep algorithm [Frey, Hinton, Dayan
1996] (HWS), (5) the same Helmholtz Machine
where a mean field approximation was used for training (HMF),
(5) a fully observed and fully connected sigmoid belief network (FV),
and (6) the mixture of trees (MT) model.
Table 2:
Average log-likelihood (bits per digit) for the single digit (Digit)
and double digit (Pairs) datasets. Results are averaged over 3 runs.
 |
Digits |
Pairs |
| 16 |
34.72 |
79.25 |
| 32 |
34.48 |
78.99 |
| 64 |
34.84 |
79.70 |
| 128 |
34.88 |
81.26 |
As shown in Figure 13, the MT model yields the best
density model for the simple digits and the second-best model for pairs
of digits. A comparison of particular interest is between the MT
model and the mixture of factorial (MF) model. In spite of the
structural similarities in these models, the MT model performs
better than the MF model, indicating that there is structure in
the data that is exploited by the mixture of spanning trees but is
not captured by a mixture of independent variable models. Comparing the
values of the average likelihood in the MT model for digits and
pairs we see that the second is more than twice the first. This
suggests that our model (and the MF model) is able to perform
good compression of the digit data but is unable to discover the
independence in the double digit set.
Figure 13:
Average log-likelihoods (bits per digit) for
the single digit (a) and double digit (b) datasets.
Notice the difference in scale between the two figures.
 |
Next: The ALARM network
Up: Density estimation experiments
Previous: Density estimation experiments
Journal of Machine Learning Research
2000-10-19