


Next: The NURSERY dataset
Up: Classification with mixtures of
Previous: The AUSTRALIAN data set
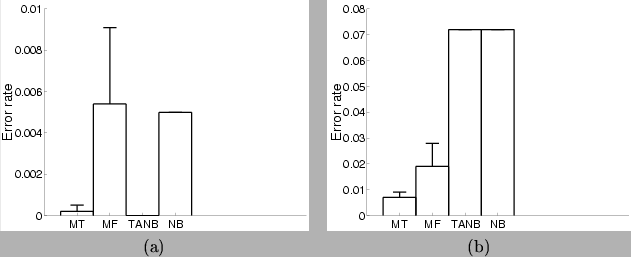
Figure 14:
Classification results for the mixtures of trees and other models: (a)
On the AGARICUS-LEPIOTA data set; the MT has  , and the MF has
 . (b) On the NURSERY data set; the MT has , the MF
has
. (b) On the NURSERY data set; the MT has , the MF
has  . TANB and NB are the tree augmented naive Bayes and
the naive Bayes classifiers respectively. The plots show the
average and standard deviation test set error rate over 5
trials.
. TANB and NB are the tree augmented naive Bayes and
the naive Bayes classifiers respectively. The plots show the
average and standard deviation test set error rate over 5
trials.
 |
The AGARICUS-LEPIOTA data [Blake, Merz 1998] comprises 8124 examples,
each specifying the 22 discrete attributes of a species of mushroom in the
Agaricus and Lepiota families and classifying it as edible or
poisonous. The arities of the variables range from 2 to 12. We created
a test set of  examples and a training set of
 examples. Of the latter, 800 examples were kept aside
to select
examples. Of the latter, 800 examples were kept aside
to select  and the rest were used for training. No smoothing was
used. The classification results on the test set are presented in
figure 14(a). As the figure suggests, this is a
relatively easy classification problem, where seeing enough examples
guarantees perfect performance (achieved by the TANB). The MT
(with ) achieves nearly optimal performance, making one mistake
in one of the 5 trials. The MF and naive Bayes models follow about 0.5%
behind.
and the rest were used for training. No smoothing was
used. The classification results on the test set are presented in
figure 14(a). As the figure suggests, this is a
relatively easy classification problem, where seeing enough examples
guarantees perfect performance (achieved by the TANB). The MT
(with ) achieves nearly optimal performance, making one mistake
in one of the 5 trials. The MF and naive Bayes models follow about 0.5%
behind.
Next: The NURSERY dataset
Up: Classification with mixtures of
Previous: The AUSTRALIAN data set
Journal of Machine Learning Research
2000-10-19